A Geopolitical Map Is Only Useful If You Know What to Look For
Open any live conflict or trade-route display and the first reaction is usually the same: a lot of dots, lines and colours, and no clear sense of what matters. A good geopolitical map such as the World Monitor on GeoMoneyTV is not meant to be admired. It is meant to help an analyst ask better questions in the first ten minutes of the day, before prices start to move. This article explains how to read a map of that kind without overreading it.
What a map can and cannot tell you
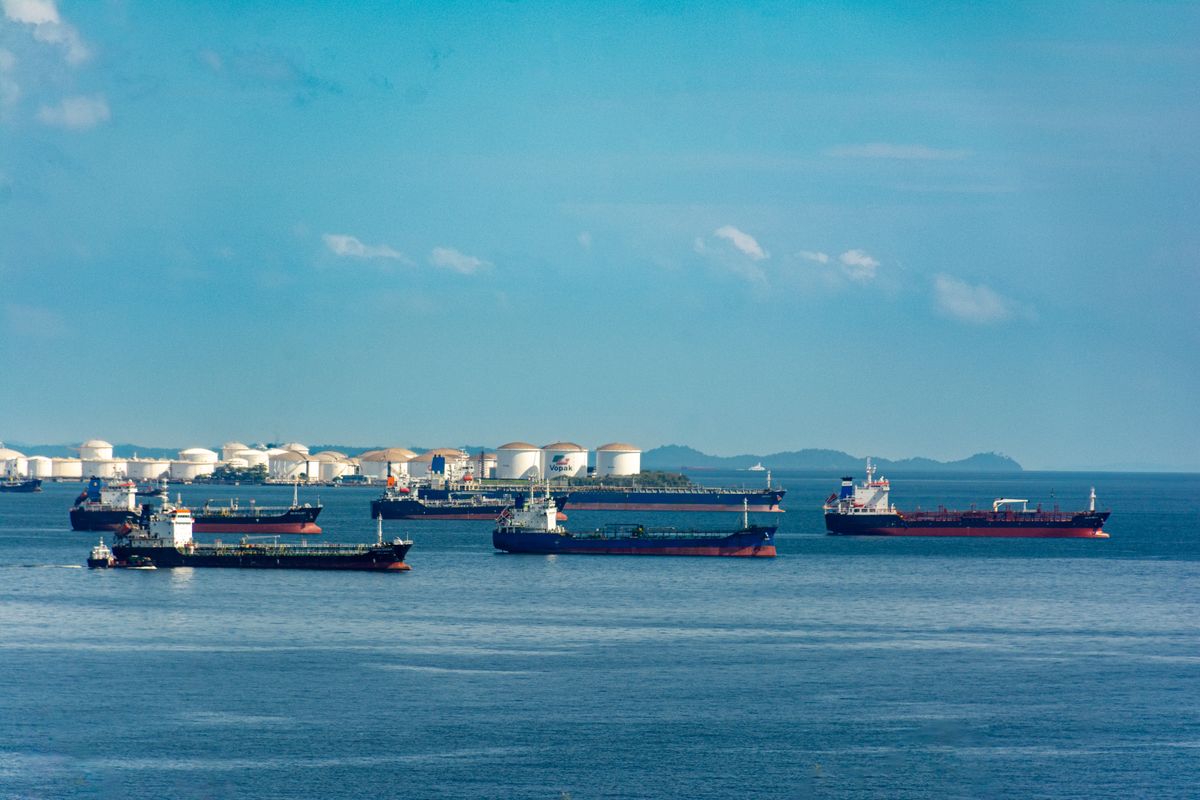
A map shows position, density and movement. It does not show intent, and it does not explain why a cluster has formed. A group of ships waiting outside a port might be a queue caused by weather, a strike or an inspection regime, and each of those has a different market meaning. Treat every pattern as a prompt for a question, not as an answer.
The practical habit is to write the question in a line before looking at the data. For example: are more vessels waiting than last week, and does that match what the freight market is saying? Writing the question stops the common error of seeing a story simply because the picture is dramatic.
Layers that matter for markets
Not all layers are equal. For energy and commodity desks, the useful ones tend to be shipping lanes near chokepoints, tanker and bulk carrier traffic, port congestion, pipeline and grid infrastructure, and sanctions-related restrictions. For macro investors, border tensions, exercise areas and election calendars may matter more. Pick a short list of layers that match your exposure and keep the rest switched off.
Overlaying too many layers makes the picture noisy and encourages false correlations. A cleaner approach is to add one layer at a time and note what each one changes in your view. Over a few weeks you learn which layers move your decisions and which only decorate the screen.
Reading movement, not just position
A snapshot is less useful than a comparison. Compare today with seven days ago and thirty days ago. Look for changes in traffic volume, routes taken and waiting times. A sustained shift matters more than a one-day spike, and a shift that appears across several sources matters more than one that appears in a single feed.
Cross-check with prices and with official statements. If traffic through a strait drops while insurance premiums rise, the signals support each other. If traffic drops and prices stay flat, the market may already have priced the event or may be discounting its duration. Either reading is informative, but you only see it when you put the sources side by side.
From map to monitoring routine
The strongest users of maps have a routine. They check the same views at the same time, record observations in a log and flag anything that breaks pattern. Over time the log becomes a private record of what normal looks like. Our note on what a geopolitical risk monitoring platform should show you each morning describes a simple morning checklist that fits this approach.
If your work involves both macro and company analysis, add a weekly review to the routine. Ask which signals from the week changed your view of a position and which did not. Retire the signals that never matter. This discipline prevents dashboards from growing into collections of decorations.
Linking the map to energy markets
Energy is where maps earn their keep. Oil, gas and LNG move through narrow corridors, and a disruption at one point shows up in prices, freight rates and inventories within days. A map that tracks vessel movement near those corridors gives early warning that written reports lag behind. For a fuller view of how supply risk and price behaviour connect, see the coverage on energy market intelligence, which sets map observations next to market data.
The same logic applies to critical minerals and metals, where processing and export controls matter as much as mining. A short explainer on how analysts treat real-time market intelligence during supply shocks shows how teams combine monitoring with decision rules.
Common mistakes when using maps
The first mistake is reading a single data point as a trend. The second is mixing sources with different update times and drawing conclusions from the gaps. The third is confusing activity with threat: military movement near a border may be routine training, and the useful question is whether the pattern differs from the same season last year. The fourth is forgetting that the map covers only what can be observed, which leaves out private negotiations and policy shifts.
A fifth mistake is ignoring the cost of attention. A dashboard that consumes an hour each morning but changes no decision is a poor use of time. Keep the review short and tie it to a specific purpose, whether that is position sizing, hedging or briefing a client.
Pairing maps with analysis and tools
Maps work best alongside written analysis and quantitative tools. A written briefing explains context. A price screen shows the market's view. A calendar lists scheduled events. Together, they reduce the chance that you misread a single input. Teams that need broader coverage often combine a monitor with real-time macro intelligence tools, so that a change on the map can be tested against flows, rates and positioning.
A simple starting setup
Choose three layers. Choose a fixed time of day. Write the question you want the map to answer. Record what you see in two sentences. At the end of the week, count how many entries changed a decision. If the number is zero, change the layers or the question. If it is high, you have a routine worth keeping.
Final thoughts
A map is a tool for asking better questions, and its value depends on the habits of the person using it. Start small, compare across time and always cross-check with prices and written sources. To talk to the team about the platform or request coverage for a region you follow, use the contact page for GeoMoneyTV and describe the markets you care about.