GeoMoney Intelligence Platform | World Energy Notes

Energy, geopolitics and market intelligence notes from GeoMoney Intelligence Platform — geomoneytv.com

Teams that depend on imported metals, energy or shipping often say they are drowning in data and still surprised by events. The problem is rarely a lack of numbers. It is that the numbers arrive in different places, at different speeds and with no shared context. Good real-time macro intelligence tools solve this by putting prices, maps and news in one view and by making it easy to record why a figure matters. The GeoMoney Intelligence Platform, built for analysts who follow energy and critical materials, is one example of this approach, and the principles below apply whichever product you choose to use. Many readers start by exploring a set of real-time macro intelligence tools to see how prices and maps fit together before deciding what their own team needs.

Cargo containers stacked at a busy shipping port

This guide is for procurement leads, risk managers, researchers and small investment teams. It explains what a good tool should do, how to read a metal price such as cobalt with the right amount of caution, how to bring geopolitics into a routine without overreacting, and how to keep a simple record that improves decisions. It is general information and not investment advice.

What Good Tools Should Actually Do

A useful tool has three jobs. First, it collects the signals you already follow so you do not need ten browser tabs. Second, it shows the relationship between signals, for example a price change next to a shipping disruption or a policy announcement. Third, it helps you remember what you concluded last time. Tools that only display charts do the first job. Tools that also support notes, alerts and shared views do all three.

Pay attention to freshness and sourcing. A price that updates every minute is valuable only if you know where it comes from and how it is assessed. A map is useful only if it shows the date of the latest data. Look for clear labels, visible timestamps and links to underlying sources. If a tool hides these details, treat its output as a starting point and verify important facts elsewhere.

Finally, check how easily colleagues can use it. The best tool is the one your team opens every day. If it takes an hour to learn, it will be used by one enthusiast and ignored by everyone else. A short training session and a one-page guide on what to check each morning usually matter more than additional features.

Reading a Metal Price Such as Cobalt

Take the cobalt price as an example. Cobalt is mined mostly as a by-product of copper and nickel, which means its supply does not respond quickly to its own price. Demand comes from batteries, alloys and chemicals, each with different buyers and different sensitivity to cost. A single headline number hides all of this, so ask which form is quoted, what purity, where it is delivered and when the assessment was made.

Next, ask what has changed recently. Mine output, export quotas, refinery capacity and stock levels all affect the market. A rise in price with rising inventories tells a different story from a rise with falling inventories. A drop in price during a period of strong demand may point to oversupply, while the same drop during weak demand may be a reflection of slowing orders. Always interpret the move in light of the other facts.

Be careful with comparisons across sources. Two reputable price reports can differ by a noticeable margin because they sample different transactions, apply different adjustments or publish at different times of day. If you switch sources midway through a quarter, note the date and the reason, otherwise your history will contain a jump that is really a change of method. Consistency in how you record data is often more valuable than chasing the single best source.

Then think about your own exposure. A manufacturer with long-term contracts may feel little change for months, while a trader holding inventory feels it at once. Writing down how a ten percent move would affect your costs or margins makes the discussion concrete. It also shows which price levels deserve alerts and which are just noise.

Bringing Geopolitics Into the Routine

Metals and energy do not move only on economics. Conflict, sanctions and transport disruptions can change availability quickly, and buyers who ignore them are often the last to know. A short monthly review of regional risks is better than occasional panic. Choose the regions that matter to your supply chain, list the key facilities, ports and routes, and watch for events that touch them.

Visual tools help here. A military aircraft tracker is one way to see activity patterns that suggest tension, though it should never be read in isolation. Movements can have routine explanations, and a single flight tells you little. The value lies in comparing patterns over time and checking them against news, shipping data and official statements.

Scenario thinking helps too. Instead of predicting one outcome, describe two or three plausible paths, such as stable supply, a moderate disruption and a severe disruption, and note how each would affect your costs and delivery times. Attach a rough likelihood and the early warning signs for each. When events unfold, you can see which path is emerging and act on a plan you wrote calmly, rather than improvising under pressure.

Avoid the temptation to turn every alert into a forecast. Instead, write down what you see, what it might mean and what evidence would confirm or contradict your reading. This habit protects you from confirmation bias and creates a record you can review later. If a pattern turns out to be nothing, you will learn from that too.

Keeping a Simple Record That Improves Decisions

A one-page weekly log is enough for most teams. Include the date, the key prices you track, two or three notable events, your interpretation and any action taken. Add a line for what you will watch next week. After a quarter, you will see which signals helped and which wasted time. That feedback loop is worth more than any single dashboard.

Think about escalation paths as well. Decide in advance who is told when an alert fires, who can approve a change in purchasing, and how quickly the decision must be made. Many organisations have good information and slow decisions, and the delay costs more than any single misjudged forecast. A one-line rule such as “two triggers in a week means a call with procurement” is enough to keep everyone aligned.

Share the log with colleagues. When finance, operations and procurement read the same short note, discussions begin from a shared picture instead of three different ones. Link to earlier work where it helps. For example, our explainers on the lithium carbonate price, the uranium price and the gallium price show how the same questions about grade, timing and context apply to very different markets.

Finally, review your tools once a year. Markets change, products improve and your own needs evolve. Ask whether the tool still covers the signals you care about, whether alerts are useful or noisy, and whether your colleagues still use it. A short review keeps your setup aligned with the decisions you actually make and prevents the slow drift into habits that no longer serve you.

Every morning an analyst opens a dozen tabs: news wires, shipping maps, commodity quotes and policy updates. By the time the picture is assembled, half the morning is gone and the most important change may be buried in the wrong tab. Good geopolitical risk analysis is not about collecting more information. It is about arranging the right information so that a change in risk becomes visible quickly. GeoMoney Intelligence Platform was built around that idea, and this guide explains a routine that any research team, investor or risk manager can follow, with or without a dedicated platform.

Chalkboard world map with a toy aircraft

The routine below has four parts: scan the map, check the physical flows, test the price signal and write down what you think. It takes about thirty minutes and produces a short note you can compare with the next day's note.

Start With the Map, Not the Headlines

Headlines tell you what an editor thought was interesting. A map tells you where things are. Begin each morning by looking at a geographic view that shows conflict zones, shipping lanes, energy infrastructure and mineral sources. Ask a simple question first: what is different from yesterday? A new cluster of incidents near a strait, an unusual concentration of vessels waiting outside a port or a pipeline route that now sits close to a disputed border are all worth noting.

Many people skip this step because it feels too basic, yet it is where the most useful questions come from. A headline about a sanctions package becomes far more meaningful when you can see which refineries, tankers and ports it touches. Keep a record of the two or three places that changed, not a long list of everything you saw.

Avoid the temptation to treat every dot on a map as a signal. Maps show coverage as well as events, and a quiet area may simply have fewer sensors or reporters. Always ask whether an apparent change reflects real activity or a change in how the activity is observed.

Check the Physical Flows

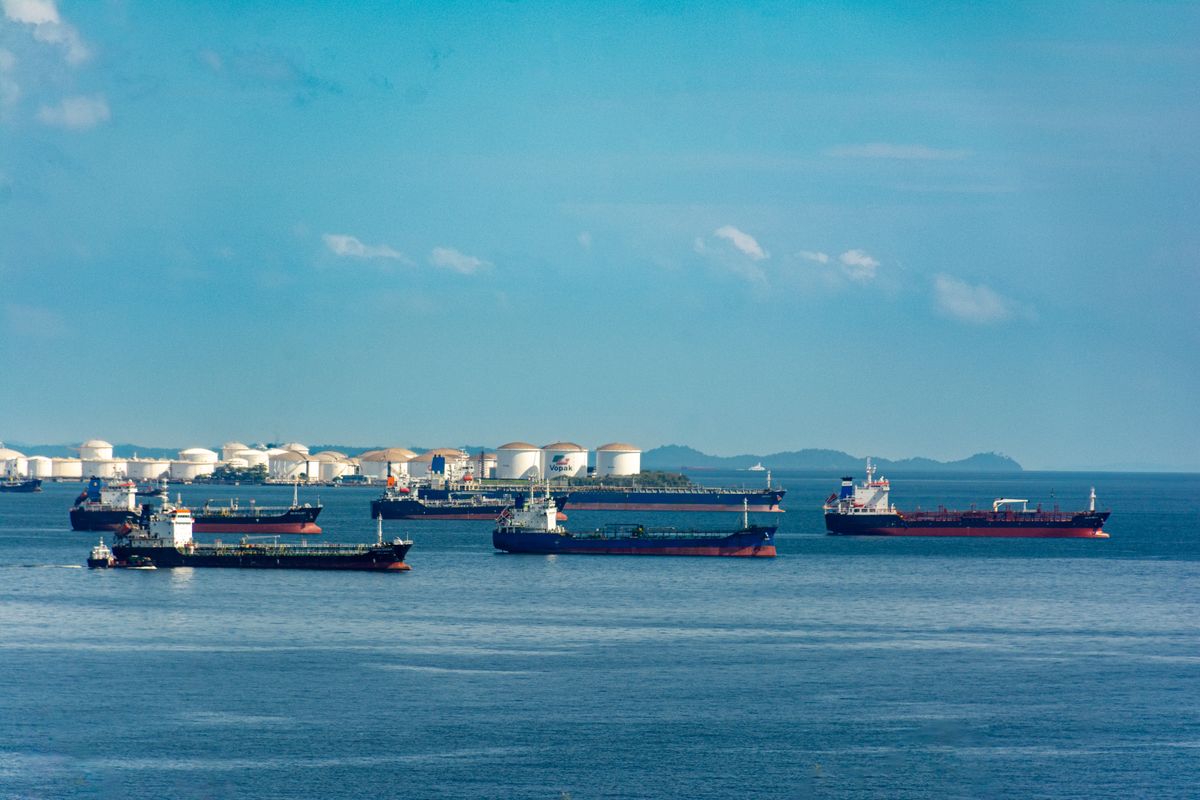
Risk becomes real when goods stop moving or move at a different cost. After the map, look at the flows that carry money and materials. An oil tanker tracker is a practical example. It shows where cargoes are heading, how long vessels are waiting and whether routes are changing. A sudden rise in waiting times at a loading port may indicate a disruption long before a price quote moves.

Pay attention to the difference between observed data and inference. A vessel that stops transmitting is not proof of wrongdoing, and a route change may be driven by weather, insurance costs or a charterer's decision. Write down what you saw, then separately write what you think it means. Keeping those two lines apart makes your note easier to check later and protects you from building a story on a single data point.

The same discipline applies to pipelines, power plants and grids. Note maintenance announcements, unusual outages and new capacity. Infrastructure risk is slow-moving and often visible in public documents long before it becomes a market event, which makes it a good place for patient analysts to find an edge.

Our earlier piece on how to write an energy market research note readers can check goes deeper into separating evidence from interpretation in a written briefing.

Test the Price Signal

Prices are the market's summary of what participants believe. After studying maps and flows, check whether prices agree with what you saw. If a corridor looks tighter but the benchmark has not moved, either the market has already priced the change or it is unaware. Both possibilities deserve a note.

Be careful with commodity names and units. Prices for a metal can refer to different grades, forms and delivery terms, and a number quoted without its product description can mislead. This matters for materials such as the magnets used in electric motors, where the price of the underlying element and the price of the finished product move for different reasons. If you follow rare earth magnets closely, track the element prices and the supply chain steps behind them, not just a single headline figure.

Compare several indicators rather than one. A currency move, a freight rate and an inventory figure together tell a more reliable story than any alone. When three independent signals point in the same direction, your confidence can rise. When they disagree, record the disagreement and the reason you think it exists.

A useful companion is our guide on mapping critical minerals supply chain risk from mine to magnet, which shows how to trace a supply chain across several countries and processing stages.

Write Down What You Think and Why

The final step is the one most people skip. Spend ten minutes writing a short note with three headings: what changed, what it might mean and what would prove you wrong. Be specific. Instead of writing that tensions are rising, write which route, which commodity and which date you are watching, and what would make you change your view.

This habit has two benefits. First, it forces you to separate observation from opinion, which improves the quality of your thinking. Second, it creates a record you can review. After a month, read your notes and mark which judgments were right, which were wrong and which were never tested. That review is where real improvement comes from, because it shows your own patterns, such as consistently overweighting dramatic events or underestimating slow structural changes.

Share the note with colleagues in a consistent format. A team that uses the same headings can compare views quickly and spot disagreements early. Keep the note short, because a one-page brief is more likely to be read and discussed than a twenty-page report.

Finally, resist the urge to predict. Good risk analysis is about preparing for several outcomes, not betting on one. List the plausible scenarios, give each a rough likelihood and decide in advance what you would do if it unfolded. That is what turns analysis into a decision and makes the thirty minutes worthwhile.

If you would like to see how a single research view can bring maps, flows and prices together for your own routine, you can explore the platform or get in touch through the Contact Us page and tell the team what you monitor. A short conversation about your workflow is often enough to show where a better arrangement of information could save you time. You can also read more about geopolitical risk analysis on the main site, where the map, energy and materials views sit side by side, and see our weekly framework for investors in this earlier post.

Open any live conflict or trade-route display and the first reaction is usually the same: a lot of dots, lines and colours, and no clear sense of what matters. A good geopolitical map such as the World Monitor on GeoMoneyTV is not meant to be admired. It is meant to help an analyst ask better questions in the first ten minutes of the day, before prices start to move. This article explains how to read a map of that kind without overreading it.

A large cargo ship crossing open water

What a map can and cannot tell you

A map shows position, density and movement. It does not show intent, and it does not explain why a cluster has formed. A group of ships waiting outside a port might be a queue caused by weather, a strike or an inspection regime, and each of those has a different market meaning. Treat every pattern as a prompt for a question, not as an answer.

The practical habit is to write the question in a line before looking at the data. For example: are more vessels waiting than last week, and does that match what the freight market is saying? Writing the question stops the common error of seeing a story simply because the picture is dramatic.

Layers that matter for markets

Not all layers are equal. For energy and commodity desks, the useful ones tend to be shipping lanes near chokepoints, tanker and bulk carrier traffic, port congestion, pipeline and grid infrastructure, and sanctions-related restrictions. For macro investors, border tensions, exercise areas and election calendars may matter more. Pick a short list of layers that match your exposure and keep the rest switched off.

Overlaying too many layers makes the picture noisy and encourages false correlations. A cleaner approach is to add one layer at a time and note what each one changes in your view. Over a few weeks you learn which layers move your decisions and which only decorate the screen.

Reading movement, not just position

A snapshot is less useful than a comparison. Compare today with seven days ago and thirty days ago. Look for changes in traffic volume, routes taken and waiting times. A sustained shift matters more than a one-day spike, and a shift that appears across several sources matters more than one that appears in a single feed.

Cross-check with prices and with official statements. If traffic through a strait drops while insurance premiums rise, the signals support each other. If traffic drops and prices stay flat, the market may already have priced the event or may be discounting its duration. Either reading is informative, but you only see it when you put the sources side by side.

From map to monitoring routine

The strongest users of maps have a routine. They check the same views at the same time, record observations in a log and flag anything that breaks pattern. Over time the log becomes a private record of what normal looks like. Our note on what a geopolitical risk monitoring platform should show you each morning describes a simple morning checklist that fits this approach.

If your work involves both macro and company analysis, add a weekly review to the routine. Ask which signals from the week changed your view of a position and which did not. Retire the signals that never matter. This discipline prevents dashboards from growing into collections of decorations.

Linking the map to energy markets

Energy is where maps earn their keep. Oil, gas and LNG move through narrow corridors, and a disruption at one point shows up in prices, freight rates and inventories within days. A map that tracks vessel movement near those corridors gives early warning that written reports lag behind. For a fuller view of how supply risk and price behaviour connect, see the coverage on energy market intelligence, which sets map observations next to market data.

The same logic applies to critical minerals and metals, where processing and export controls matter as much as mining. A short explainer on how analysts treat real-time market intelligence during supply shocks shows how teams combine monitoring with decision rules.

Common mistakes when using maps

The first mistake is reading a single data point as a trend. The second is mixing sources with different update times and drawing conclusions from the gaps. The third is confusing activity with threat: military movement near a border may be routine training, and the useful question is whether the pattern differs from the same season last year. The fourth is forgetting that the map covers only what can be observed, which leaves out private negotiations and policy shifts.

A fifth mistake is ignoring the cost of attention. A dashboard that consumes an hour each morning but changes no decision is a poor use of time. Keep the review short and tie it to a specific purpose, whether that is position sizing, hedging or briefing a client.

Pairing maps with analysis and tools

Maps work best alongside written analysis and quantitative tools. A written briefing explains context. A price screen shows the market's view. A calendar lists scheduled events. Together, they reduce the chance that you misread a single input. Teams that need broader coverage often combine a monitor with real-time macro intelligence tools, so that a change on the map can be tested against flows, rates and positioning.

A simple starting setup

Choose three layers. Choose a fixed time of day. Write the question you want the map to answer. Record what you see in two sentences. At the end of the week, count how many entries changed a decision. If the number is zero, change the layers or the question. If it is high, you have a routine worth keeping.

Final thoughts

A map is a tool for asking better questions, and its value depends on the habits of the person using it. Start small, compare across time and always cross-check with prices and written sources. To talk to the team about the platform or request coverage for a region you follow, use the contact page for GeoMoneyTV and describe the markets you care about.

Close-up of a world globe

Most people follow international affairs one crisis at a time. A sanctions package, a naval incident, a trade dispute, an election result: each arrives as a separate story with its own headline cycle. The problem is that the world does not behave as a set of separate stories. Alliances, trade routes, energy supply and financial pressure all push on one another. Good global power dynamics analysis, the kind GeoMoney Intelligence Platform builds its coverage around, starts from that connection rather than from the latest headline.

This note sets out a practical way to read those dynamics as one system, and why that matters for anyone with money, supply chains or policy exposure on the line.

Power is exercised through systems, not speeches

Statements from leaders get the attention, but power in practice is exercised through a small number of systems that can be measured:

  • Trade routes and chokepoints, where shipping, pipelines and cables can be disrupted or protected.
  • Financial plumbing, including payment networks, reserve currencies and access to capital markets.
  • Energy and resource supply, which decides who can keep factories, grids and armies running.
  • Technology and industrial capacity, especially in semiconductors, defence production and clean energy equipment.
  • Alliances and security guarantees, which change how much risk a country is willing to take.

When analysis is organised around these systems, a single event becomes easier to place. A new export restriction is not just a trade story; it is a move in the technology system that may invite a response in the resource or financial system.

Reading sanctions as a two-way process

Sanctions are a good example of why linked analysis matters. The initial measure is usually well reported. The adaptation that follows is not.

Targeted countries reroute trade through third countries, build alternative payment channels, discount their exports to new buyers and use older or unflagged shipping. Each of those adaptations creates new winners and losers. Ports and traders in intermediary countries gain volume. Buyers who take discounted supply gain a cost advantage. Enforcement agencies respond with secondary measures, and the cycle repeats.

An analyst who only reads the first announcement will misjudge the real effect. An analyst who tracks the adaptation can often see where the next enforcement action, or the next price dislocation, is likely to land.

Energy as the most visible lever

Energy remains the clearest channel through which shifts in power reach ordinary prices. Supply cuts, pipeline disputes, attacks on shipping and changes in producer group policy all show up quickly in fuel and power costs.

For that reason, it helps to keep the oil and gas picture inside any geopolitical workflow, rather than treating it as a separate sector to check later. Market intelligence on oil and gas that covers export flows, spare capacity, refinery outages and shipping insurance gives an early read on how a political move is likely to be felt. It also shows when markets are ignoring a risk that the political picture suggests is growing.

Trade routes and chokepoints

A handful of maritime chokepoints carry a large share of world trade and energy. Disruption at any of them has an immediate cost through longer voyages, higher freight and insurance rates, and delayed deliveries.

Watching these routes means tracking more than incidents. Insurance premiums, rerouting decisions by major carriers, naval deployments and port congestion are all signals that risk is rising before a crisis becomes a headline. The same approach is laid out in our earlier piece on turning global events into portfolio decisions, which explains how to translate route risk into specific exposures.

A simple framework for linked analysis

Teams that do this well tend to follow a similar routine:

  1. Log the event and identify which of the five systems it touches first.
  2. Map the likely response from the other side, and which system that response will use.
  3. List the exposures, such as commodities, currencies, sectors or suppliers, affected at each step.
  4. Set indicators that would confirm or rule out each step, so the view can be updated quickly.
  5. Revisit on a fixed schedule, because many power shifts unfold over months rather than days.

This framework is easier to keep up with a single platform built for geopolitical risk intelligence that keeps events, maps and market data together, instead of switching between news feeds, spreadsheets and price screens. The point is not more information; it is the same information arranged so that connections are visible. We made a similar argument about why geopolitical and market intelligence belong on the same screen, and it applies even more strongly when several regions are under pressure at once.

Where analysis usually goes wrong

Some recurring mistakes are worth naming:

  • Assuming rational, single-goal actors. Governments balance domestic politics, economics and security, and often accept costs that look irrational from outside.
  • Over-weighting military events. Financial and trade measures often have larger and longer-lasting market effects.
  • Ignoring the middle powers. Countries that trade with all sides frequently decide how effective sanctions and alliances really are.
  • Confusing volatility with change. A sharp price move does not always mean the balance of power has shifted; sometimes it reverts within days.

Turning analysis into a watchlist

Analysis only helps if it changes what a team watches. After mapping an event through the five systems, the output should be a short watchlist: two or three indicators per system, each with a level or development that would change the view. Examples include a jump in war-risk insurance for a shipping route, a new payment arrangement between sanctioned and neutral states, or a change in producer group quotas. Reviewing that list on a fixed schedule keeps attention on the signals that matter, rather than on whichever story is loudest that day.

Why this matters now

The current period is marked by more competition between large economies, more use of trade and finance as tools of pressure, and more fragile supply chains for energy and critical inputs. In that environment, reading each crisis on its own is a reliable way to be surprised. Reading power as a connected system does not remove uncertainty, but it shows where the next pressure point is most likely to appear and which exposures would feel it first.

For questions about how this approach could support your own research or risk process, you can contact the GeoMoney Intelligence Platform team.

The market intelligence platform category is crowded enough that the label itself has stopped meaning much. Dashboards, news aggregators, alert services, and full research terminals all claim the term, and the price range across them spans two orders of magnitude. For a desk trying to decide what's actually worth paying for, the label is close to useless — the only thing that matters is what the platform does with information once it arrives, not what it's called.

The Line Between Aggregation and Intelligence

Most tools calling themselves a market intelligence platform are, underneath the branding, aggregation tools: they pull headlines, prices, and filings into one interface and call the consolidation itself the value. That's a real convenience, but it's not intelligence — it's organization. Genuine intelligence starts where aggregation ends: connecting a data point to what it means for a specific position, flagging when a pattern echoes a previous situation, and surfacing the second-order effects a headline doesn't state directly. A lot of platforms stop at the first step and let the analyst do all of the second.

What to Actually Test Before Committing

Rather than evaluating a platform on its feature list, it's more useful to run it through a handful of specific scenarios:

  • Feed it a real historical event from the past year and see how quickly it would have surfaced the relevant signal, not just the eventual headline.
  • Check whether it connects developments across categories — does a commodity supply story get linked to the currency and equity exposure it affects, or does it sit in its own silo?
  • Look at how it handles a slow-burn story that develops over weeks rather than a single dramatic event — does it maintain context across updates, or does each new development arrive without reference to what came before?
  • Ask what happens when the platform is wrong. Every intelligence tool produces false positives; the ones worth using make it easy to see why a signal was flagged and easy to dismiss it, rather than burying the reasoning behind a black-box score.

Vendors rarely volunteer answers to these questions in a demo, which is exactly why they're worth asking directly.

Why Category Breadth Matters More Than It Seems

A platform narrowly focused on one asset class or region can be excellent within that scope and still miss the point for a desk with broader exposure. Energy, commodities, currencies, and geopolitical risk increasingly move together — a development in one rarely stays contained, and a platform that only covers one slice of that picture forces the analyst to manually stitch together the rest from other sources. That stitching is exactly the kind of manual work a market intelligence platform is supposed to eliminate, not create.

Where GeoMoney TV Sits in This

This is the specific gap GeoMoney TV's market intelligence platform is built to close — covering energy, critical minerals, and geopolitical risk as a single connected feed rather than a narrow single-category tool. The goal isn't to be the loudest source of alerts; it's to be the one an analyst can trust enough to act on without independently re-verifying every signal from scratch, because the platform already did the cross-referencing that would otherwise eat the first ten minutes of any research task.

Pricing Is a Signal, Not Just a Cost

It's worth noting that the cheapest option in this category is rarely the best value once the manual verification work is priced in. A low-cost aggregator that still requires an analyst to manually cross-check every alert against other sources isn't actually cheap — it's shifting the cost from subscription fee to analyst time, which is usually the more expensive line item. The platforms that earn a premium price tend to earn it by removing that manual step entirely, not by adding more raw data to an already-overloaded feed.

A Simple Framework for the Decision

For teams evaluating options, a useful shortcut is to ask: would this platform have changed a specific decision we made in the last quarter, and how much earlier would we have made it? If the honest answer is “not much,” the platform is providing convenience rather than edge — which may still be worth paying for, but shouldn't be marketed or budgeted as intelligence. If the answer is a genuine, specific instance where earlier signal would have changed positioning, that's the platform worth prioritizing.

The Bottom Line

The market intelligence platform label covers a wide range of actual capability, from simple news aggregation to genuine cross-category signal analysis, and the price tag doesn't reliably indicate which one you're getting. The only real test is whether a platform changes what an analyst can act on and how quickly — everything else is presentation. For teams who want to run that test directly, it's worth getting in touch with the GeoMoney TV team for a walkthrough of the platform in action.

Most people who care about geopolitics and markets are subscribed to too many things and reading almost none of them properly. That's not a discipline problem — it's a design problem. A geopolitical intelligence newsletter that lands three times a week competing with forty other unread items in an inbox is going to lose that fight most of the time, no matter how good the analysis inside it actually is. The ones that get read consistently are built differently, and it's worth being specific about what that difference looks like.

The real competition isn't other newsletters

It's easy to assume the competition for attention is other geopolitical or market newsletters. In practice, the real competition is everything else in an inbox — internal emails, calendar reminders, client correspondence — all fighting for the same few minutes someone has between meetings. A newsletter that wins that fight consistently isn't necessarily the most comprehensive one. It's the one that respects the reader's actual constraint, which is time, and delivers a clear point rather than a wall of context that requires a dedicated reading session to get through.

This is a genuinely different design problem than writing a research report. A report can assume a reader who has set aside time and wants depth. A newsletter has to assume a reader who is deciding, in the first five seconds, whether this is worth the next ninety.

What separates a newsletter people actually open

The newsletters that build real reading habits share a few traits. They're specific rather than exhaustive — three sharp, well-argued points beat twelve mentioned in passing, because the reader can actually retain three. They connect events to consequences explicitly, rather than assuming the reader will make the leap from “this happened” to “this is why it matters to you” on their own. And they're consistent in format and cadence, so opening the email becomes a habit rather than a decision made fresh every time it arrives.

There's also a trust dimension that compounds over time. A newsletter that flags something as significant and is later proven right earns the kind of attention that a newsletter which cries wolf on every minor development never builds. That track record is slow to establish and easy to damage, which is exactly why it's worth protecting by being selective about what gets flagged as urgent.

Why this format still matters in a world of real-time alerts

It might seem like a scheduled newsletter is an outdated format next to real-time dashboards and alert systems, but the two serve different functions. Real-time tools are for tracking positions and catching disruptions as they happen. A well-built newsletter is for synthesis — stepping back periodically to connect the dots between things that happened separately and explain the pattern underneath them, which is a different cognitive task than monitoring a live feed. Teams that rely only on real-time alerts often miss the slower-moving structural stories precisely because nothing about them triggers an urgent alert on any single day.

GeoMoney TV's regular intelligence briefing is built around that synthesis role specifically — a consistent, scheduled read that connects the geopolitical and market threads that unfolded since the last one, rather than trying to compete with real-time monitoring on its own terms.

Building the reading habit, not just the sending habit

The responsibility for making a newsletter valuable doesn't sit entirely with the publisher. Readers who get the most out of this kind of format tend to treat it as a fixed calendar appointment rather than something to get to eventually — five minutes at a consistent point in the week, read fully rather than skimmed between other tasks. That small structural choice is often the actual difference between a subscription that quietly builds context over months and one that becomes another unread badge count.

If you're evaluating how to keep a consistent read on geopolitical and market developments without adding another feed to constantly monitor, a scheduled briefing is worth testing against whatever you're currently using. Contact Us if you'd like to see a sample before subscribing.

Newsletter and market briefing

A transformer fire at a substation. A pipeline segment taken offline for unscheduled maintenance. A grid operator issuing an emergency capacity alert during a heat wave. None of these events make it into most market coverage until the outage is already affecting supply — and by then, whatever repricing was going to happen has largely happened. Keeping track of energy infrastructure risk before it becomes a headline is one of the more underrated disciplines in market intelligence, mostly because infrastructure itself is unglamorous compared to production numbers and pricing data.

Infrastructure risk hides in plain sight

Production figures and inventory reports get analyst attention because they're scheduled, structured, and easy to build a routine around. Infrastructure risk is messier — it's distributed across thousands of individual assets (pipelines, substations, refineries, LNG terminals, transmission lines), and a disruption to any one of them can matter disproportionately depending on where it sits in the network. A minor-looking outage at a chokepoint facility can move markets more than a major-looking outage somewhere with more redundancy built around it. That asymmetry is exactly why generic monitoring, which treats every facility as roughly equivalent, misses the events that actually matter.

The result is a coverage gap that's easy to underestimate until it costs something. A desk that only tracks headline production and price data is functionally blind to the infrastructure layer sitting underneath both — until an outage forces a price move that looks, from the outside, like it came out of nowhere.

Why this window of the year deserves particular attention

Heat-driven grid stress, hurricane-season exposure for coastal refining and LNG infrastructure, and maintenance schedules that were deferred earlier in the year all tend to converge in this stretch of the calendar. It's a period when infrastructure risk is structurally elevated relative to the rest of the year, which means the cost of not tracking it closely is also higher than usual. Desks that treat infrastructure monitoring as a year-round baseline rather than a seasonal add-on are better positioned for exactly this kind of window, because the tracking habit and the data pipeline are already in place when the risk spikes rather than being built reactively.

Connecting the asset to the market

The most useful infrastructure risk intelligence doesn't stop at “this facility went offline.” It connects that event to what it actually means downstream — which regional markets lose supply, which alternative routes or facilities absorb the gap, and how long the disruption is likely to last based on the type of outage and historical repair timelines for similar incidents. That connective layer is what separates a genuinely actionable alert from a raw incident report that still requires manual interpretation before anyone can act on it.

GeoMoney TV's energy infrastructure coverage is built around that connective layer specifically — tracking individual facility and network-level disruptions and tying them back to the markets and price benchmarks they actually affect, rather than treating infrastructure and pricing as two separate beats that a reader has to reconcile on their own.

Building infrastructure awareness into a standard workflow

Teams that do this well tend to maintain an explicit map of the facilities and corridors that matter most to their specific exposure, rather than trying to track everything with equal weight. That map gets revisited periodically, because chokepoint risk shifts as new capacity comes online or as geopolitical dynamics change which corridors carry more strategic weight. It also gets paired with a clear internal process for how a flagged disruption gets triaged and escalated, so infrastructure alerts don't sit in the same queue as lower-priority news and get missed during a busy trading day.

The cost of skipping this isn't usually a single catastrophic miss — it's a steady drag of reactive positioning, hedges placed after the move instead of ahead of it, and research time spent reconstructing what happened instead of anticipating it. Over a full year, that drag adds up to a meaningful gap between desks that treat infrastructure as core coverage and those that still treat it as background noise.

If energy infrastructure exposure is part of your book and the current process for tracking it is more reactive than you'd like, it's worth a conversation about what a continuously updated view would surface. Contact Us and the team can talk through the current coverage map.

Energy infrastructure and grid

Oil and gas desks have never had access to more data. What most of them still lack is a way to turn that data into something usable before the trading window closes. Prices for benchmark crude, refined products, and regional gas contracts move on a constant stream of inputs — OPEC+ signaling, refinery outages, tanker congestion, sanctions enforcement, weather disruption to production basins — and a good oil and gas intelligence dashboard exists specifically to compress that stream into something a desk can act on in minutes rather than hours.

The gap between data and decision

There is a common misconception that more data automatically means better decisions. In practice, the opposite is often true early on: a flood of unfiltered headlines, satellite imagery reports, and shipping trackers can slow a desk down as much as help it, because someone still has to sort signal from noise before a call gets made. The value of a dashboard-style tool isn't that it adds more inputs — it's that it does the sorting continuously, so the human step starts from “here's what changed and why it matters” instead of “here's forty new alerts, go figure out which ones are real.”

That distinction matters most during fast-moving weeks — a Gulf shipping incident, an unexpected OPEC+ statement, a major field going offline for maintenance that runs long. Late July into August tends to bring exactly this kind of volatility, as summer demand peaks collide with maintenance schedules and hurricane-season supply risk in producing regions. Desks that are still triaging headlines manually during those stretches are working at a structural disadvantage against anyone running a live, filtered view of the same events.

What a useful dashboard actually tracks

Not all monitoring tools are built the same, and it's worth being specific about what separates a genuinely useful one from a glorified news aggregator. The better ones combine price and inventory data with event-level context — tying a price move back to the specific disruption that caused it, rather than presenting the two separately and leaving the analyst to connect them. They track regional spreads, not just headline benchmarks, since a lot of the real trading opportunity lives in the gap between WTI, Brent, and regional grades rather than in the headline number itself. And they flag second-order effects — a refinery outage in one region often shows up as a demand shift for a specific product in another, and that connection is easy to miss without a system built to surface it.

GeoMoney TV built its energy intelligence coverage around exactly this kind of layered view — production and shipping data cross-referenced against the geopolitical events driving them, updated continuously rather than in a daily digest that's already stale by the time it lands in an inbox.

Where teams get the most value

The desks getting the most out of this kind of tooling tend to share a habit: they don't just watch the dashboard passively, they build workflows around it. That means routing specific alert categories to specific people — someone owns shipping and logistics disruption, someone else owns policy and sanctions, someone else owns production data — so nothing sits unclaimed when it comes in. It also means setting a standard for how quickly a flagged event needs a human response, so the tool's speed advantage doesn't get lost in an internal queue.

Smaller trading and research teams sometimes assume this kind of infrastructure is only worth building once you're operating at a scale that justifies a dedicated research desk. That's backwards. The teams with the least spare capacity are the ones who benefit most from having triage done automatically, since they can't afford to have someone manually reading wires for three hours a day just to stay current.

The real cost of staying manual

Every quarter that a desk delays consolidating its market intelligence into a single continuously updated view is a quarter spent re-litigating the same problem: too many sources, not enough synthesis, decisions made a step behind where they could be. That's not a criticism of the analysts doing the manual work — it's a statement about the ceiling that manual triage puts on how fast any team can move, regardless of how good the people on it are.

If oil and gas exposure is a meaningful part of your book and the current process still runs through a patchwork of newsletters and wire alerts, it's worth a direct conversation about what a consolidated view would look like for your specific positions. Contact Us and the team can walk through what's already tracked and where the gaps are worth closing first.

Oil and gas market data