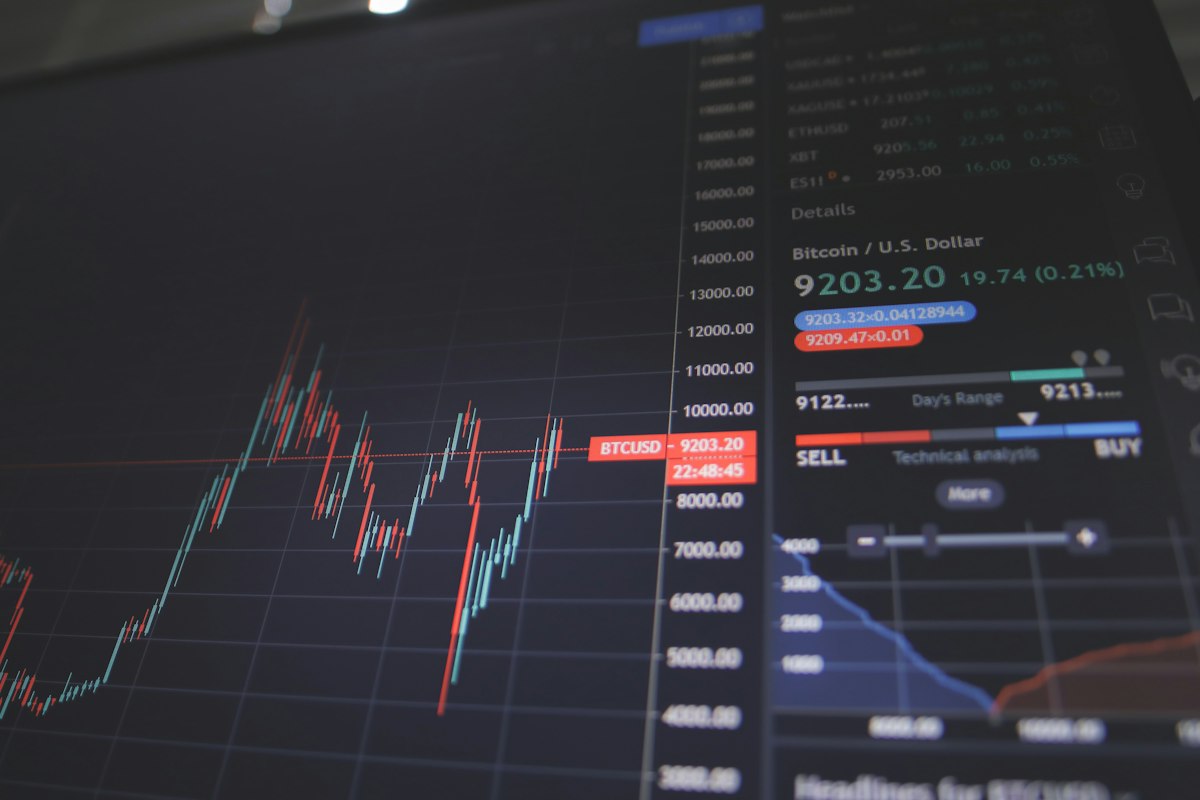
What a Real Oil and Gas Intelligence Dashboard Should Actually Do
Oil and gas desks have never had access to more data. What most of them still lack is a way to turn that data into something usable before the trading window closes. Prices for benchmark crude, refined products, and regional gas contracts move on a constant stream of inputs — OPEC+ signaling, refinery outages, tanker congestion, sanctions enforcement, weather disruption to production basins — and a good oil and gas intelligence dashboard exists specifically to compress that stream into something a desk can act on in minutes rather than hours.
The gap between data and decision
There is a common misconception that more data automatically means better decisions. In practice, the opposite is often true early on: a flood of unfiltered headlines, satellite imagery reports, and shipping trackers can slow a desk down as much as help it, because someone still has to sort signal from noise before a call gets made. The value of a dashboard-style tool isn't that it adds more inputs — it's that it does the sorting continuously, so the human step starts from “here's what changed and why it matters” instead of “here's forty new alerts, go figure out which ones are real.”
That distinction matters most during fast-moving weeks — a Gulf shipping incident, an unexpected OPEC+ statement, a major field going offline for maintenance that runs long. Late July into August tends to bring exactly this kind of volatility, as summer demand peaks collide with maintenance schedules and hurricane-season supply risk in producing regions. Desks that are still triaging headlines manually during those stretches are working at a structural disadvantage against anyone running a live, filtered view of the same events.
What a useful dashboard actually tracks
Not all monitoring tools are built the same, and it's worth being specific about what separates a genuinely useful one from a glorified news aggregator. The better ones combine price and inventory data with event-level context — tying a price move back to the specific disruption that caused it, rather than presenting the two separately and leaving the analyst to connect them. They track regional spreads, not just headline benchmarks, since a lot of the real trading opportunity lives in the gap between WTI, Brent, and regional grades rather than in the headline number itself. And they flag second-order effects — a refinery outage in one region often shows up as a demand shift for a specific product in another, and that connection is easy to miss without a system built to surface it.
GeoMoney TV built its energy intelligence coverage around exactly this kind of layered view — production and shipping data cross-referenced against the geopolitical events driving them, updated continuously rather than in a daily digest that's already stale by the time it lands in an inbox.
Where teams get the most value
The desks getting the most out of this kind of tooling tend to share a habit: they don't just watch the dashboard passively, they build workflows around it. That means routing specific alert categories to specific people — someone owns shipping and logistics disruption, someone else owns policy and sanctions, someone else owns production data — so nothing sits unclaimed when it comes in. It also means setting a standard for how quickly a flagged event needs a human response, so the tool's speed advantage doesn't get lost in an internal queue.
Smaller trading and research teams sometimes assume this kind of infrastructure is only worth building once you're operating at a scale that justifies a dedicated research desk. That's backwards. The teams with the least spare capacity are the ones who benefit most from having triage done automatically, since they can't afford to have someone manually reading wires for three hours a day just to stay current.
The real cost of staying manual
Every quarter that a desk delays consolidating its market intelligence into a single continuously updated view is a quarter spent re-litigating the same problem: too many sources, not enough synthesis, decisions made a step behind where they could be. That's not a criticism of the analysts doing the manual work — it's a statement about the ceiling that manual triage puts on how fast any team can move, regardless of how good the people on it are.
If oil and gas exposure is a meaningful part of your book and the current process still runs through a patchwork of newsletters and wire alerts, it's worth a direct conversation about what a consolidated view would look like for your specific positions. Contact Us and the team can walk through what's already tracked and where the gaps are worth closing first.